Monitoring MySQL databases is essential for maintaining performance, detecting issues early, and ensuring efficient resource use by tracking critical metrics. With MySQL supporting various applications, it’s important to have the right tools in place to monitor database health and performance. Proper monitoring helps finding slow queries, resource limitations, and security issues before they affect operations.
This article examines the top 5 MySQL monitoring tools, providing insights into each tool’s capabilities and how they optimize MySQL server environments.
How to Choose the Best MySQL Monitoring Tool for Your Business Needs
Before exploring the top MySQL monitoring tools, it’s important to consider key factors that determine the best fit for your needs. Each organization has specific requirements, so understanding what matters most in a monitoring tool makes the selection process simpler and more effective. Key aspects to consider include:
- Installation and Ease of Use: The tool should be easy to set up and configure. A complicated installation process can cause delays in deployment and lead to additional maintenance tasks.
- Customization of Alerts: The tool should offer the ability to set custom alerts based on specific conditions. This ensures notifications about issues relevant to your environment.
- Real-time Performance Tracking: The monitoring tool should provide analytics in real-time, allowing you to track key performance metrics like query execution time, CPU and memory usage, and error rates.
- Dashboard and Visualization Features: An intuitive, customizable dashboard is essential for simplifying monitoring tasks. Tools with strong visualization capabilities help administrators identify performance issues and optimize configurations more efficiently.
Top 5 MySQL Monitoring Tools
Monitoring tools are critical for identifying performance issues and maintaining MySQL database health. With many options available, selecting the right tool for performance monitoring can be challenging. Understanding each tool’s unique features helps make an informed choice for optimizing database performance.
We’ve compiled a list of the top five MySQL monitoring tools to help guide your decision. These tools offer real-time analytics, advanced visualization, customizable alerts, and scalability. They meet the needs of both single MySQL databases and complex environments with multiple instances.
Percona Monitoring and Management (PMM)

Percona Monitoring and Management (PMM) is a free, open-source platform for monitoring MySQL database performance. It provides essential performance metrics to monitor for effective MySQL database management and optimization. PMM offers real-time server data, providing insights into the health and performance of your databases.
PMM also helps to identify slow queries and inefficient indexes, enabling administrators to make informed decisions to enhance database performance.
Key Features:
- Advanced query analytics for pinpointing performance bottlenecks
- Immediate access to server data for comprehensive MySQL performance monitoring insights
- Open-source, free to use, promoting broad adoption
- Compatibility with various MySQL releases and support for pluggable storage engines, improving query execution efficiency
Pricing: Free (Open-source)
Best for: Users seeking a powerful, accessible tool tailored to monitor MySQL database performance at no cost.
Datadog MySQL Monitoring

Datadog is an enterprise monitoring tool that tracks MySQL performance metrics and statistics. It integrates with MySQL to deliver insights via a cloud-based platform. Datadog offers real-time analytics, customizable dashboards, and machine learning-driven alerts, helping users find slow database queries, optimize performance, and manage resources effectively.
Key Features:
- Real-time analytics providing immediate performance insights
- Customizable dashboards to monitor MySQL performance according to user needs
- Machine learning-based alerts for proactive issue management
- Comprehensive tracking of MySQL performance schema and buffer pool usage
Pricing: Freemium model with paid tiers for advanced features.
Best for: Enterprises that need advanced analytics and customizable monitoring for MySQL databases, including MySQL Enterprise Edition.
Prometheus + Grafana
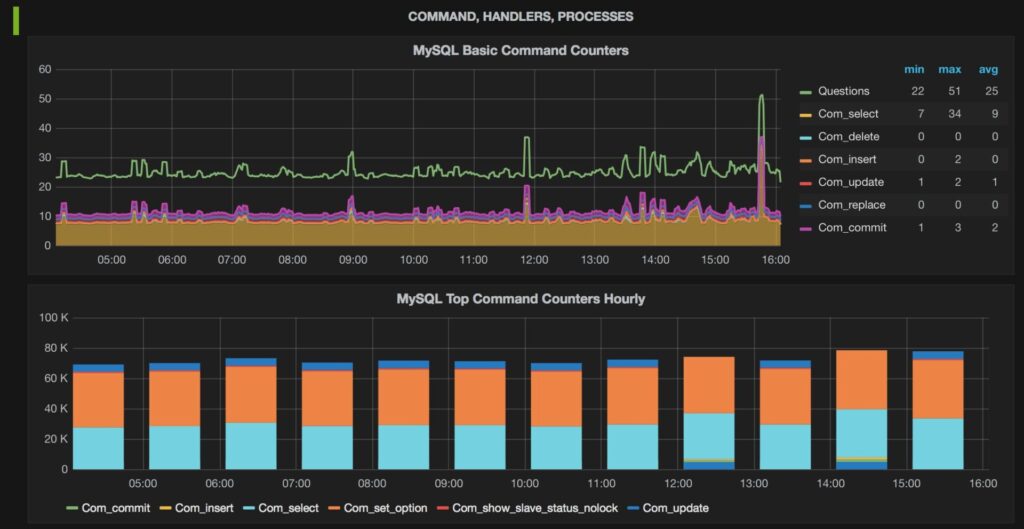
Prometheus, paired with the MySQLD Exporter, collects detailed performance metrics from MySQL databases, offering in-depth insights into database health. When combined with Grafana, Prometheus becomes an even more powerful tool, allowing the creation of customizable dashboards that improve data visualization. However, despite being highly adaptable and flexible for MySQL monitoring, it lacks distributed tracing capabilities.
Learn how to monitor MySQL deployments at ScaleGrid using Prometheus and Grafana for scalable performance insights.
Key Features:
- Collects comprehensive performance data using MySQLD Exporter, including MySQL query performance metrics
- Advanced visualization through customizable dashboards with Grafana
- Supported by a strong open-source community, ensuring continuous improvements
- Scalable and adaptable to various monitoring needs
Pricing: Free and open-source software.
Best for: Users needing detailed performance metrics and robust visualization tools for MySQL.
New Relic Database Monitoring
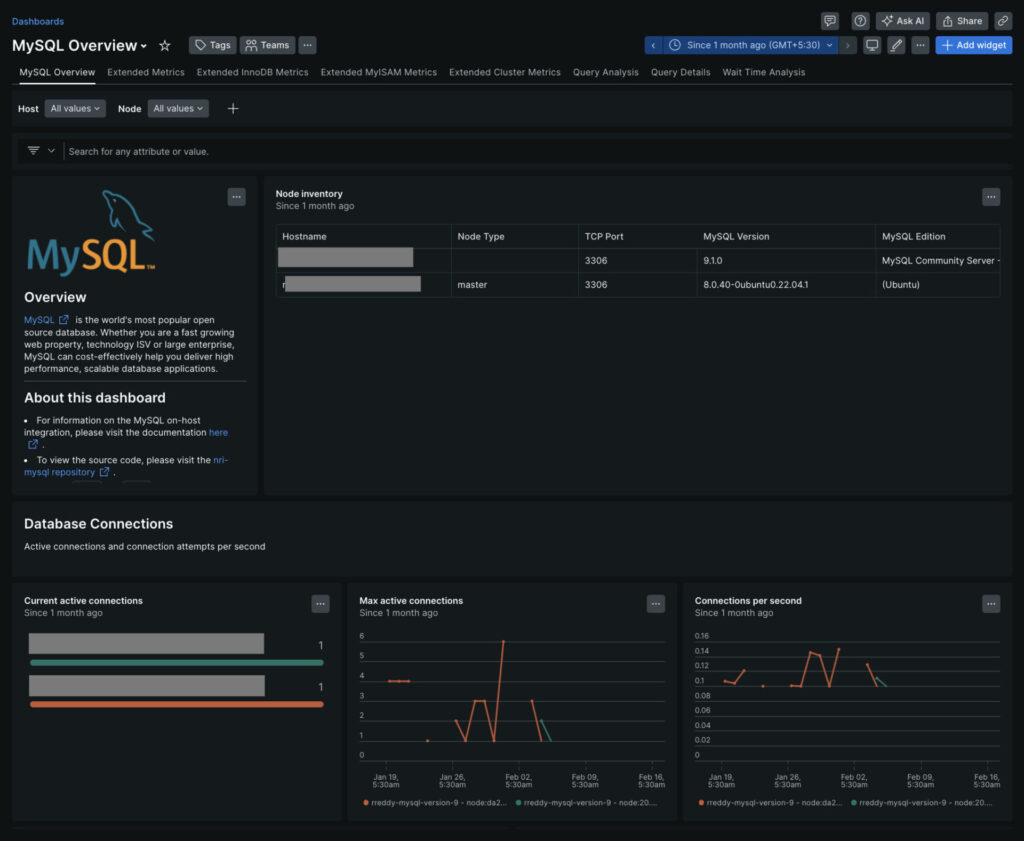
New Relic integrates with MySQL to provide in-depth performance monitoring, collecting data from MySQL databases on various platforms. It enables real-time visibility into key metrics such as query response times, throughput, and error rates. New Relic’s visualization tools help track performance indicators and analyze query efficiency, making it easier to identify inefficiencies in MySQL operations.
Key Features:
- Real-time observation of query response times and throughput
- Extensive visualization tools for tracking performance metrics
- In-depth analysis of individual queries and overall database querying processes, helping resolve bottlenecks and improve database functionality
- Designed to scale across various database sizes and types
Pricing: Paid packages available, with a free trial option.
Best for: Organizations looking for an extensive monitoring solution with advanced visual representations of MySQL database health.
Zabbix for MySQL

Zabbix is a powerful monitoring tool that uses agent-based tracking tailored for MySQL database servers. It also offers backup monitoring, allowing users to track backup processes alongside other critical performance metrics. Zabbix provides valuable insights into MySQL operations and helps detect potential issues before they cause disruptions. With configurable alerts, Zabbix notifies users of performance changes or anomalies, enabling quick responses. It monitors key metrics like query execution efficiency, buffer allocation, and server availability, ensuring superior MySQL performance.
Key Features:
- Agent-based analysis for thorough system health evaluation
- Configurable alerts for real-time notifications of performance changes
- Monitoring of key metrics, including query throughput, system parameters, and service continuity
- Open-source with active community support
Pricing: Free under an open-source license.
Best for: Users seeking detailed agent-driven monitoring with customizable alerting for MySQL database management.
Best Practices for MySQL Monitoring
To ensure optimal MySQL performance, administrators should monitor key performance metrics such as query execution time, transaction throughput, memory usage, and disk usage. System metrics, like CPU and memory usage, are also crucial for detecting resource utilization constraints.
To identify performance bottlenecks, administrators can analyze queries, review query logs, and examine metrics. Optimization techniques such as indexing, caching, and query refinement effectively improve performance.
Using tools like MetricFire and Datadog to monitor performance metrics helps identify and resolve issues. By following these best practices, administrators can maintain optimal database performance, prevent issues, and enhance overall efficiency. Regular performance checks with tools like MySQL Enterprise Monitor ensure continuous improvement and database optimization.
Choosing the Best MySQL Monitoring Tool for Cost-Effective Performance
| Tool | Best Use Cases | Strengths | Weaknesses |
|---|---|---|---|
| Percona Monitoring and Management (PMM) | Best Free Tool Best for Open-Source Monitoring |
Advanced query analytics, real-time server insights, compatibility across MySQL versions, fully open-source. | Requires manual setup, limited enterprise-grade features. |
| Datadog MySQL Monitoring | Best for Enterprises Best for Cloud Monitoring |
Real-time analytics, machine learning alerts, customizable dashboards, deep MySQL integration. | High cost at scale, complex pricing structure. |
| Prometheus + Grafana | Best for Customization Best for Open-Source Visualization |
Detailed metric collection with MySQLD Exporter, highly customizable dashboards, strong community support. | Requires complex setup, no built-in distributed tracing. |
| New Relic Database Monitoring | Best for Developers Best for Cross-Platform Monitoring |
Real-time query tracking, extensive visualization tools, scalable monitoring across databases. | Paid-only for full features, basic MySQL-specific metric depth. |
| Zabbix for MySQL | Best for On-Premise Monitoring Best for Agent-Based Tracking |
Agent-based analysis, configurable alerts, key performance metric tracking, open-source support. | Steep initial setup, dated user interface. |
Selecting the most suitable MySQL monitoring tool depends on your project’s unique requirements.
Smaller businesses may benefit from a simple, cost-effective option, while large-scale enterprises require feature-rich, scalable solutions to handle extensive database demands.
When selecting a tool, consider the following:
- Setup Simplicity: How easy is it to install and configure?
- Metric Detail: Does it provide comprehensive performance insights?
- Alert Customization: Can you tailor alerts based on specific thresholds?
- Dashboard Usability: Is the dashboard intuitive and easy to navigate?
Monitoring resource metrics is essential for understanding how databases perform in their environment. For database management beyond monitoring, discover the best MySQL GUI tools to streamline administration tasks.
It’s important to check if the tool offers real-time updates and alerts, integrates with your existing technology, and can scale as your needs grow. Choose tools that provide broad visibility, including distributed tracing for in-depth performance analysis.
Organizations focused on simplicity and cost often move to DBaaS solutions. ScaleGrid, for example, offers fully managed MySQL hosting with built-in performance monitoring, query analysis, and automated alerting, minimizing the need for manual setup.
An ideal MySQL monitoring tool tracks both essential and resource usage metrics, helping identify performance issues through effective detection methods. These tools also support database optimization by applying query refinement and performance-enhancing strategies.
Before making a choice, thoroughly evaluate what specific metrics are most important to your operation.
Choosing the Right MySQL Monitoring Solution for your Needs
| Use Case | Recommended Tool | Reason |
|---|---|---|
| Best for Enterprises | Datadog MySQL Monitoring | Real-time analytics, machine learning-driven alerts, cloud-based scalability for enterprise environments. |
| Best Free Tool | Percona Monitoring and Management (PMM) | Fully open-source, real-time server insights, advanced query analytics, zero cost. |
| Best for Customization | Prometheus + Grafana | Detailed metric collection, highly customizable dashboards, open-source flexibility. |
| Best for Developers | New Relic Database Monitoring | Real-time tracking, extensive visualization tools, strong support for full-stack performance monitoring. |
| Best for On-Premise Monitoring | Zabbix for MySQL | Agent-based tracking, configurable alerts, strong monitoring for in-house infrastructure. |
| Best for Cloud Integration | Datadog MySQL Monitoring | Native cloud integration, strong MySQL performance schema tracking, seamless scalability. |
| Best Open-Source Visualization | Prometheus + Grafana | Community-driven support, flexible graphing options, customizable MySQL dashboards. |
| Best for Agent-Based Monitoring | Zabbix for MySQL | Detailed system health evaluation through agent-based architecture with alert customization. |
Effective MySQL monitoring and database security are key to maintaining optimal performance, reliability, and security. Tools like Paessler PRTG Network Monitor provide comprehensive solutions by combining database monitoring with broader IT infrastructure oversight. With customizable dashboards, pre-configured sensors, and scalable licensing, PRTG helps address performance issues and improve system health.
The right tool depends on your organization’s needs, including scalability, tracking features, and support. Solutions range from open-source to commercial, each offering distinct features for various environments. Ultimately, the best MySQL monitoring tool will align with your project’s size, growth plans, and ability to track critical metrics effectively.