
Redis® is an in-memory database that provides blazingly fast performance. This makes it a compelling alternative to disk-based databases when performance is a concern. You might already use ScaleGrid hosting for Redis hosting to power your performance-sensitive applications. How do you ensure that your Redis deployment is healthy and meeting your requirements?
You will need to know which monitoring metrics for Redis to watch and a tool to monitor these critical server metrics to ensure its health. Redis returns a big list of database metrics when you run the info command on the Redis shell. You can pick a smart selection of relevant metrics from these. These can help you ensure your system’s health and quickly perform root cause analysis of any performance-related issue you might be encountering.
This blog post lists the important database metrics to monitor. We will look at each metric from a database performance perspective and discuss the common issues and associated solutions.
Key Takeaways
- Critical performance indicators such as latency, CPU usage, memory utilization, hit rate, and number of connected clients/slaves/evictions must be monitored to maintain Redis’s high throughput and low latency capabilities.
- Key metrics like throughput, request latency, and memory utilization are essential for assessing Redis health, with tools like the MONITOR command and Redis-benchmark for latency and throughput analysis and MEMORY USAGE/STATS commands for evaluating memory.
- Effective management of memory stores with policies like LRU/LFU proactive monitoring of the replication process and advanced metrics such as cache hit ratio and persistence indicators are crucial for ensuring data integrity and optimizing Redis’s performance.
Understanding Redis Performance Indicators

Redis is designed to handle high traffic and low latency with its in-memory data store and efficient data structures. It can achieve impressive performance, handling up to 50 million operations per second.
This is because it stores the data in main memory rather than on disk, making it quickly accessible for multiple Redis instances. Effective monitoring of key performance indicators plays a crucial role in maintaining this optimal speed of operation.
These include measuring metrics such as average response time (latency), CPU usage, which offers insights into resource utilization and potential bottlenecks, fragmentation ratio that evaluates how efficiently the database utilizes memory space, and blocked_clients indicating any issues with client connections. All these contribute significantly towards ensuring smooth functioning.
Evaluating factors like hit rate, which assesses cache efficiency level, or tracking key evictions from the cache are also essential elements during the Redis monitoring process.
Connected_slaves provides information about replication status while Used_memory tracks utilized amount of server’s total capacity. This comprehensive observation helps ensure peak performance levels for your Redis server by keeping an eye out on important components such as CPU usage, memory management, and connectivity-related concerns.
Core Metrics for Redis Monitoring
Effectively monitoring key memory metrics such as throughput, latency, and utilization is crucial to ensuring the reliability and effectiveness of Redis instances. These essential data points heavily influence both stability and efficiency within the system.
Throughput
Ensuring optimal performance and efficient handling of many queries is crucial for Redis, as it offers exceptional speed and minimal delay. To achieve this, monitoring the throughput through metrics to observe instantaneous processing rate, real-time streaming with the MONITOR command, or utilizing tools like Redis- benchmark is essential.
Throughput tells you how many database operations your server is performing in a particular time duration. It depends upon your application workload and its business logic. By looking at the history of throughput, you can infer the load pattern on a server, e.g., peak load, the frequency of peak load, the time frames of peak load, average load, etc.
You can collect throughput metric values for all the commands run on the Redis server by executing “info commandstats”.
<code>127.0.0.1:6379> info commandstats
# Commandstats
cmdstat_get:calls=797,usec=4041,usec_per_call=5.07
cmdstat_append:calls=797,usec=4480,usec_per_call=5.62
cmdstat_expire:calls=797,usec=5471,usec_per_call=6.86
cmdstat_auth:calls=147,usec=288,usec_per_call=1.96
cmdstat_info:calls=46,usec=902,usec_per_call=19.61
cmdstat_config:calls=2,usec=130,usec_per_call=65.00
cmdstat_eval:calls=796,usec=36950,usec_per_call=46.42
cmdstat_command:calls=796,usec=8578,usec_per_call=10.78</code>
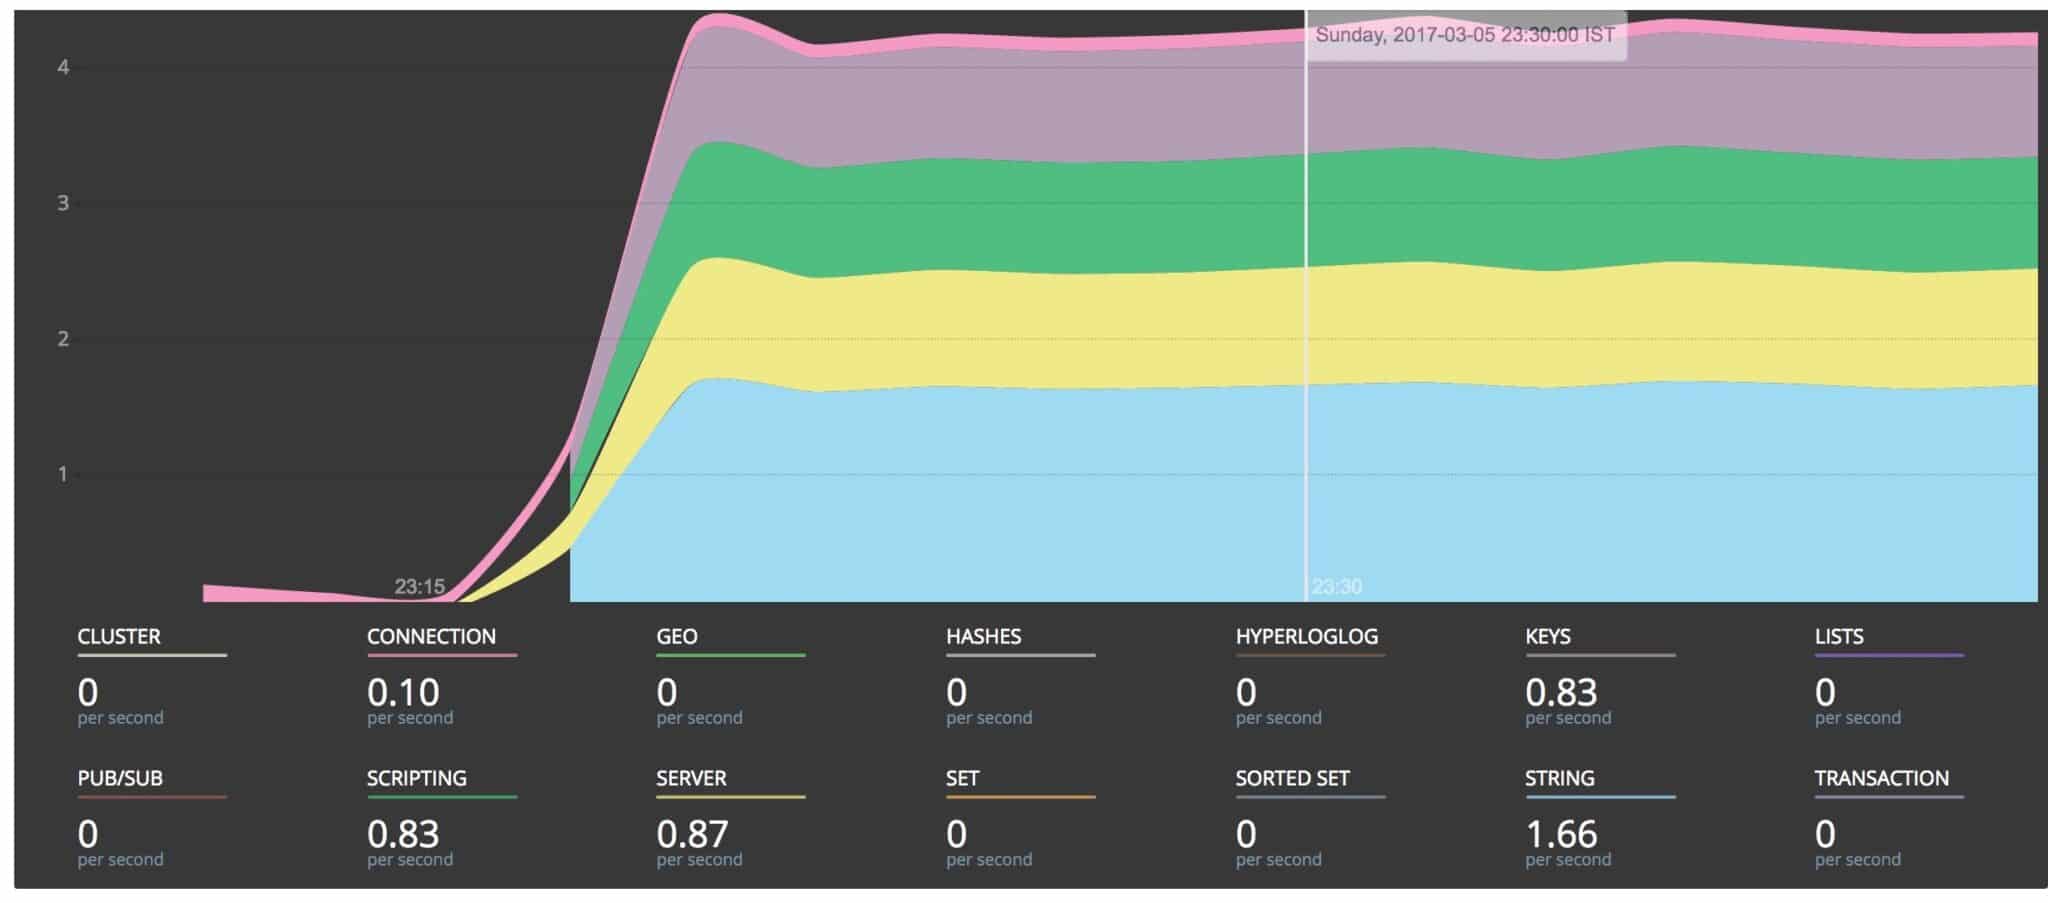
Redis groups its various commands into connection, server, cluster, generic, etc. ScaleGrid monitoring for Redis aggregates the throughput of various commands into one of the above-mentioned groups. The throughput is represented as a stacked area graph, where the height of each colored area provides the throughput of a group of commands.
Evaluating the total commands processed per second entails tracking server workload by observing its request-handling capabilities via different techniques such as immediate metric measurements, continuous real-time data flow using MONITOR command, or testing simulated workloads with the Redis benchmark program. It’s important to note that recommended throughput levels may vary depending on factors such as operating system type, network bandwidth availability, and hardware quality.
A reduced throughput could generally indicate that the server gets fewer queries. It could also indicate a potential issue, say, an expensive query. Similarly, an increased throughput signifies an intensive workload on a server and a larger latency.
Request Latency
Measuring the time delay between a client’s command and its reply reception, latency metrics play an important role in understanding Redis performance changes. One way to keep track of request latency is by enabling the latency monitor with a set threshold. For more advanced debugging purposes related to high latencies, Redis 2.6 offers the Software Watchdog specifically designed for this purpose.
Regarding Redis performance, elevated latency levels can be detrimental, resulting in longer response times and lower throughput due to delayed communication between clients’ commands and their corresponding replies.
Memory Utilization
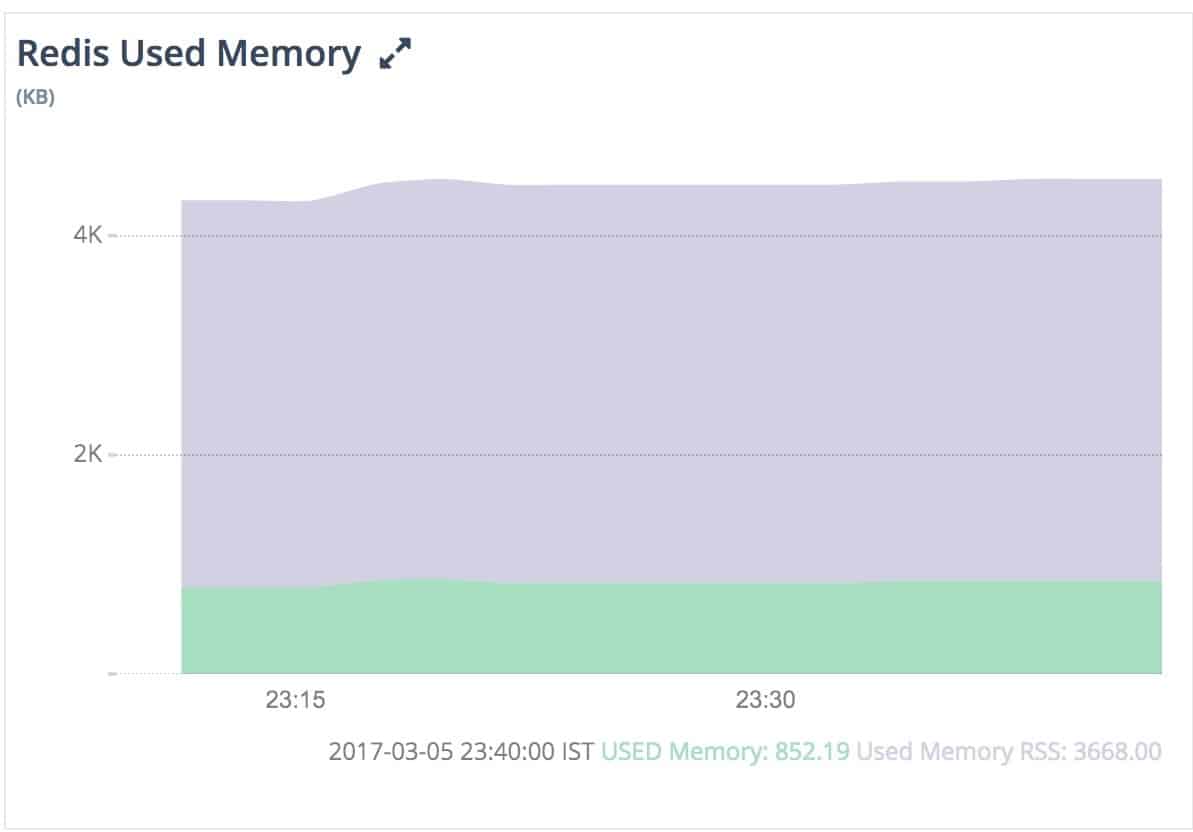
Memory is a critical resource for Redis’ performance. Used memory defines the total number of bytes allocated by Redis using its allocator (either standard libc, jemalloc, or an alternative allocator such as tcmalloc).
It is essential to effectively monitor memory usage in Redis as it can have a significant impact on database performance and may result in errors. The MEMORY USAGE and MEMORY STATS commands are useful for monitoring, while the config set command allows adjusting Redis configuration settings to optimize memory management.
Care must be taken not to over-allocate memory as this can lead to fragmentation and inefficient utilization of resources. You can collect all memory utilization metrics data for a Redis instance by running “info memory”.
127.0.0.1:6379> info memory
# Memory
used_memory:1007280
used_memory_human:983.67K
used_memory_rss:2002944
used_memory_rss_human:1.91M
used_memory_peak:1008128
used_memory_peak_human:984.50K
Sometimes, when Redis is configured with no max memory limit, memory usage will eventually reach system memory, and the server will start throwing “Out of Memory” errors.
At other times, Redis is configured with a max memory limit but noeviction policy. This would cause the server not to evict any keys, thus preventing any writes until memory is freed. The solution to such problems would be configuring Redis with max memory and some eviction policy. In this case, the server starts evicting keys using an eviction policy as memory usage reaches the max.
Memory RSS (Resident Set Size) is the number of bytes that the operating system has allocated to Redis. If the ratio of ‘memory_rss’ to ‘memory_used’ is greater than ~1.5, it signifies memory fragmentation. The fragmented memory can be recovered by restarting the server.
Cache Hit Ratio
The cache hit ratio represents the efficiency of cache usage. Mathematically, it is defined as (Total key hits)/ (Total keys hits + Total key misses).
The “info stats” command provides keyspace_hits & keyspace_misses metric data to calculate further the cache hit ratio for a running Redis instance.
127.0.0.1:6379> info stats
# Stats
.............
sync_partial_err:0
expired_keys:10
evicted_keys:12
keyspace_hits:4
keyspace_misses:15
pubsub_channels:0
pubsub_patterns:0
.............
If the cache hit ratio is lower than ~0.8 then a significant amount of the requested keys are evicted, expired, or do not exist at all. It is crucial to watch this metric while using Redis as a cache. A lower cache hit ratio results in larger latency as most requests are fetching data from the disk. It indicates that you need to increase the size of the Redis cache to improve your application’s performance.
Active Connections
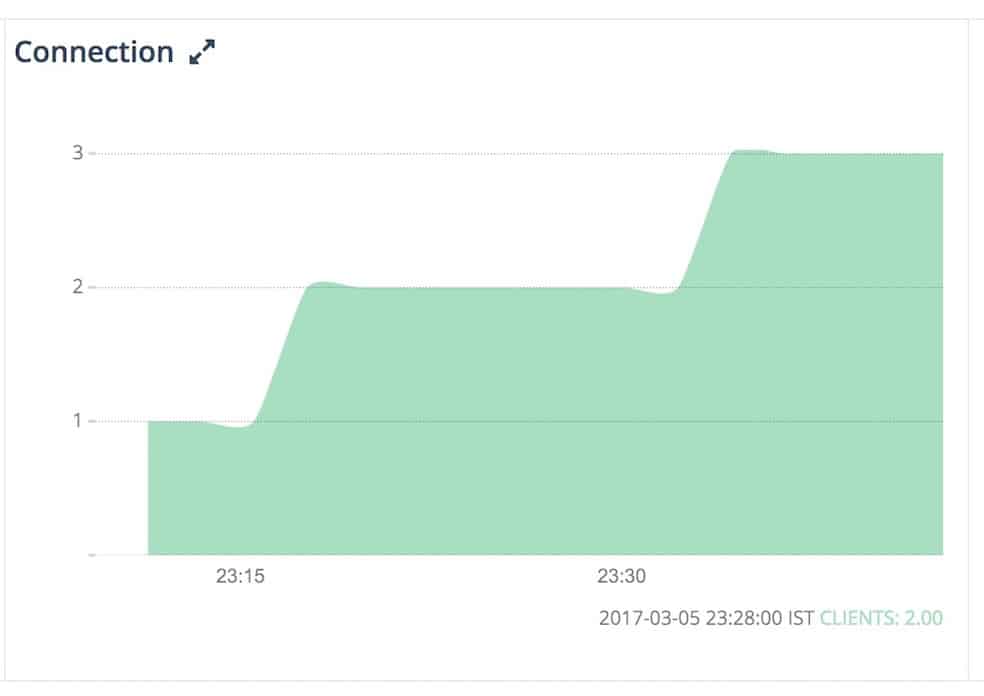
The number of connections is a limited resource that is either enforced by the operating system or by the Redis configuration. Monitoring the active connections helps ensure you have sufficient connections to serve all your requests at peak times.
One useful approach for this is to use the CLIENT LIST command, which provides comprehensive and easily understandable information on all current client connections.
A well-maintained Redis database can handle many concurrent client connections – typically up to 10,000 by default. This is a reference point when evaluating the expected range of active connections for any given Redis instance.
Evicted/Expired Keys
Redis has several key eviction policies, such as Least Recently Used (LRU), Least Frequency Used (LFU), and allkeys-lru, designed to manage memory by removing keys based on their specific usage patterns. They are used by the server when memory usage hits the maximum limit. A persistent positive value of this metric indicates that you need to scale the memory up.
A higher frequency of key evictions could be an indication of potential issues with CPU usage or increased pressure on memory resources. This can ultimately result in slower response times. Monitoring these rates regularly enables proactive management strategies that ensure optimal performance while also regulating the use of system resources. Excessive rates of key expirations and evictions may lead to data loss or decreased database efficiency, making it crucial to monitor and efficiently manage them closely.
<code>127.0.0.1:6379> info stats
# Stats
..............
sync_partial_err:0
expired_keys:0
evicted_keys:0
keyspace_hits:0
keyspace_misses:0
pubsub_channels:0
pubsub_patterns:0
..............</code>
Redis supports the TTL (time to live) property for each key. The server deletes the key if the associated TTL has elapsed. If the application does not define this property, it causes expired data to pile up in memory. A positive metric value shows that your expired data is being cleaned up properly.
Replication Health
One of the key components in ensuring data consistency and integrity within Redis is its unique identifier, the Redis Replication ID. This plays a crucial role in supervising the replication process. It is important to regularly monitor the “master_link_status” metric which indicates if there are any issues with connectivity or proper data replication between master and replica(s).
‘connected_slaves’ metric informs the reachability of the slave server to a master. Slave unreachability could lead to higher read latency depending on the read load on a server.
127.0.0.1:6379> info replication
# Replication
role:master/slave
connected_slaves:0/master_slave_io_seconds_ago:0
master_repl_offset:0
..............
The ‘master_slave_io_seconds_ago’ metric tells how much time elapses during the communication between a slave and the master. A higher value for this metric can indicate issues on the master/slave or some network problems. It further causes the slave to serve stale data.
Advanced Redis Metrics for In-Depth Analysis
Evaluating sophisticated indicators like the cache hit ratio and persistence metrics is crucial in gaining a better understanding of Redis’ effectiveness and how it optimizes usage. These advanced measures offer valuable insights into Redis’s performance, specifically its performance.
Cache Hit Ratio
The effectiveness of cache usage in Redis can be measured by the Cache Hit Ratio, which is determined by dividing the number of successful key lookups and data retrieval from the cache (cache hits) by the total number of key operations (hits + misses). A high ratio indicates efficient utilization of the cache with a significant amount of cached data being successfully retrieved.
If there is a low Cache Hit Ratio, it may negatively impact performance in Redis. This could be caused by expired or invalid data within the database.
Persistence Metrics
In Redis, key metrics such as rdb_last_save_time, rdb_changes_since_last_save, and aof_last_rewrite_time_sec are crucial for monitoring persistence. Both RDB persistence and AOF persistence are important aspects to keep track of.
The main reason behind the importance of these metrics is their ability to provide valuable insights. For example, by tracking the value of RDB_last_save_time one can determine the last time an RDB file was saved.
Similarly, keeping an eye on the changes_since_last_saves metric allows users to monitor how frequently data has been altered since the last dump. This information is useful in regularly saving data, which helps mitigate potential loss during failures or crashes.
Tools for Redis Performance Monitoring

To effectively monitor the performance of Redis, experts recommend using tools like Better Stack, Sematext Monitoring, and Atatus. For example, Prometheus makes it easy to track Redis’s performance by utilizing a special exporter that extracts data from Redis and presents it as metrics in Prometheus’s format. These metrics can be easily visualized using Grafana for a more user-friendly display.
Another useful tool is Datadog’s comprehensive platform, which combines metrics tracking, application monitoring (APM), and log management into one place. It offers specialized support for measuring the performance of Redis Enterprise through various key indicators such as latency and error rates.
Meanwhile, SigNoz has built-in features designed to gather important statistics about your applications, including average response time, error rate, and number of requests per second, all crucial aspects when evaluating overall Redis performance.
Best Practices for Redis Performance Tuning
Optimizing memory allocation is essential for improving Redis’s performance. This can be achieved through various methods such as tuning the configuration, monitoring memory usage closely, implementing the Least Recently Used (LRU) policy in Redis to prioritize frequently used data, and being mindful when assigning field names in hashes to consider their impact on overall memory consumption. It is also important to adjust kernel parameters appropriately to prevent out-of-memory (OOM) issues.
Furthermore, the wise utilization of different types Redis offers, such as strings, lists, sets, and sorted sets, allows efficient storage management.
In addition, distributed data is a key factor in high availability. This can be achieved by implementing a connection pool to manage the connections efficiently.
Summary
To maintain peak performance, it is essential to monitor key metrics in Redis closely. By thoroughly examining and evaluating factors such as throughput, latency, and memory usage, we can guarantee the stability and effectiveness of our Redis instances. Adhering to recommended methods for managing memory allocation and configuring settings can Optimize Redis’s overall performance.
Frequently Asked Questions
What should I monitor in Redis?
To maintain efficient functioning and detect potential problems, keeping track of key Redis metrics is essential. These important performance indicators should be regularly monitored for optimal results.
How do I monitor Redis memory usage?
To keep track of the amount of memory being used by Redis, access the Redis server through the redis-cli command and use “info memory” to retrieve information about its current memory usage. This will provide an overview of how much RAM is being utilized by the Redis server at that time.
How do I monitor Redis latency?
To keep track of the latency in Redis, you can access up-to-date data through either the Redis REST API or by checking for minimum latency using the redis-cli command within your server’s environment. Both methods allow for monitoring and obtaining accurate statistics regarding Redis’ performance.
What is Redis?
Redis is an efficient database that stores data in the computer’s memory. This allows for quick access.
How can you measure throughput in Redis?
The performance of a Redis server can be evaluated by recording the metric values for all commands executed using the “info commandstats” command. This method offers a comprehensive assessment of the server’s efficiency.