When it comes to analyzing the memory usage of a Redis instance, there are lots of free and open-source tools in the market, along with a smattering of paid products. Some of the most popular ones are Jacks (of all trades fame), but if you’re looking for a deeper analysis of your memory problems, you might be better off with one of the more targeted, and lesser-known tools.
In this post, we’ve compiled a list of the top 6 free tools we found most useful in analyzing memory usage of our Redis instances:
- Redis Memory Analyzer (RMA)
- Redis Sampler
- RDB Tools
- Redis-Audit
- Redis Toolkit
- Harvest
1) Redis Memory Analyzer
Redis Memory Analyzer (RMA) is one of the most comprehensive FOSS memory analyzers available for Redis. It supports three different levels of details:
- Global – Overview of memory usage information.
- Scanner – Highest level keyspace/prefix level memory usage information – in other words, the shortest common prefix is used.
- RAM – Lowest level keyspace/prefix – in other words, the longest common prefix is used.
Each mode has its own uses- you can get further details in the RMA ReadMe.
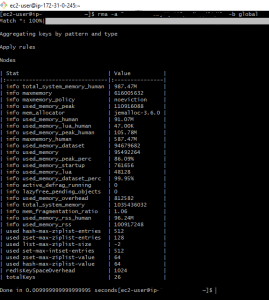
RMA – Global Mode
In the global mode, RMA provides some high-level statistics, like the number of keys, system memory, resident set size, keyspace size, etc. A unique feature is the “keyspace overhead” which is the memory used by the Redis system to store keyspace-related information, like pointers for the list data structures.
RMA – Scanner Mode
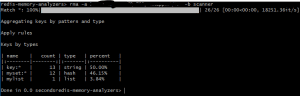
In the scanner mode, we get an overview of our keyspace. It gives the high-level namespaces (so a:b:1 and a:c:1 are clubbed together as a:*), along with the types of its items and the percentage of memory consumed by that namespace. It’s useful to start with this information and then use the ‘RAM’ behavior coupled with the namespace pattern to do a detailed analysis.
RMA – RAM Mode
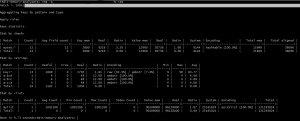
In the RAM mode, we get keyspace-level memory consumption, as provided by most of the other FOSS memory analyzers. So here, a:b:1 and a:c:1 are taken separately as a:b:* and a:c:* and we get detailed information about memory used, actual data size, overhead, encoding, min and max TTL, etc. This helps pinpoint the biggest memory-hoggers in our system.
Unfortunately, this tool is not always updated (the last commit on GitHub is more than a year ago). Even so, this is one of the best we found for detailed analysis.
RMA Installation and Usage:
RMA requires Python and PIP to be installed on the system (both are available for all major OSes). Once they’re installed, you can execute a single command to install the RDB tools – ` pip install rma`
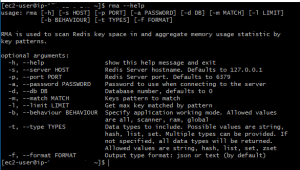
It’s pretty simple to use from the command line. The syntax is `rma [-s HOST] [-p PORT] [-a PASSWORD] [-d DB] [-m pattern-to-match] [-l number-of-keys-to-scan] [-b BEHAVIOUR] [-t comma-separated-list-of-data-types-to-scan]`
RMA Pros:
- Works in real time.
- Uses the scan command to walk through the database, hence, the performance impact is limited and analysis is very accurate.
- Well-documented – it’s easy to find usage examples.
- Supports robust customization and filtering options, including analyzing specific data types only, or, considering only keys matching a specific pattern).
- Can provide details at different levels – namespaces, keys or global values.
- Unique amongst all the tools we audited in that it shows the data structure overhead (that is, how much memory is used to store internal Redis information like the pointers for a list data type).
RMA Cons:
- Does not support probabilistic sampling. Linearly scanning the database can be very slow for large databases; there is the option to stop scanning once a certain number of keys are returned to improve performance.
- There’s a lot of details in the output; while helpful for experts, might serve only to confuse novices.
2) Redis Sampler
![]()
Redis Sampler is a very powerful tool that can give deep insights into the memory usage of a Redis instance. It’s maintained by antirez, the developer behind Redis, and that deep knowledge of Redis shows through in this tool. The tool is not updated very frequently – but there are not many issues reported anyway.
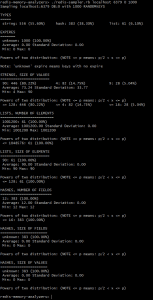
Redis Sampler does a probabilistic scan of the database and reports the following information:
- The percentage distribution of keys amongst various data types – based on the number of keys, rather than the size of objects.
- The largest keys of type string, based on strlen, and the percentage of memory they consume.
- For all other data types, the largest keys are calculated and displayed as two separate lists: one based on the size of the object, and another based on the number of items in the object.
- For every data type, it also shows a “Power of 2 distribution”. This is really useful in understanding the size distribution within a data type. The output basically details what percentage of keys of a given type are of size in the range > 2^x and <= 2^x+1.
Redis Sampler Installation and Usage:
This is a single Ruby script. It requires Ruby to be already installed. You also need `rubygems` and `redis` gems to be installed. Usage is pretty straightforward – from the command line, execute `./redis-sampler.rb `
Redis Sampler Pros:
- Very simple to use – no options to investigate and understand.
- The output is easy to understand, even for novices, but has enough information for very detailed analyses of a Redis instance by experts. The sections are clearly demarcated and easy to filter out.
- Works on all Redis versions.
- Does not use any privileged commands like DEBUG OBJECT, so it can be used on any system, including Amazon’s ElastiCache.
- It uses data type-specific length commands to identify data size, so the usage reported is not affected by serialization.
- Works on live data. Though the recommendation is to run on loopback interface, it supports sampling remote systems.
Redis Sampler Cons:
- If the sample size is set higher than database cardinality, it will still use RANDOMKEYS rather than SCAN.
- No bundle or Docker image available. You have to manually install dependencies (though on the bright side, there are only 2 dependencies).
- Reports the data size, which does not exactly match the space occupied on RAM because of data structure storage overheads.
- Does not work out-of-the-box if your Redis instance requires authentication. You need to modify the script to take a password; in simplest form you can search for:
redis = Redis.new(:host => ARGV[0], :port => ARGV[1].to_i, :db => ARGV[2].to_i)
and change it to:
redis = Redis.new(:host => ARGV[0], :port => ARGV[1].to_i, :db => ARGV[2].to_i, :password => “add-your-password-here”)
3) RDB Tools
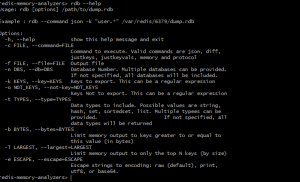
RDB Tools is a very useful suite of tools for any serious Redis administrator. There is a tool for almost every use-case we could think of, but in this post, we’ll concentrate solely on the memory analysis tool.
While nowhere near as comprehensive as RMA or Redis Sampler, RDB Tools gives 3 important pieces of information:
1) All keys where value has (serialized) size greater than B bytes [B specified by user].
![]()
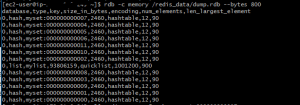
2) The largest N keys [N specified by user].
![]()
3) Size of a particular key: this is read live from the database.
This suite has many active contributors on GitHub and is pretty frequently updated. RDB Tools is also well-documented on the internet. The maintainer sripathikrishnan is well known in the Redis community for the many tools he has provided over the years.
RDB Tools Installation and Usage:
RDB Tools requires Python and PIP to be installed on the system (both are available for all major OSes). Once they’re installed, you can execute a single command to install the RDB tools – ` pip install rdbtools python-lz`
Usage is pretty straightforward:
- To get 200 largest keys: rdb -c memory /var/redis/6379/dump.rdb –largest 200 -f memory.csv
- To get all keys greater than 128 bytes: rdb -c memory /var/redis/6379/dump.rdb –bytes 128 -f memory.csv
- To get size of a key: redis-memory-for-key -s localhost -p 6379 -a mypassword person:1
RDB Tools Pros:
- Outputs a CSV file, which can be used with other FOSS tools to easily create data visualizations, and can also be imported into RDBMS-es to run analytics.
- Very well documented.
- Supports customization and filtering options, so you can get more useful reports.
RDB Tools Cons:
- Their analysis does not work on live data; you must take an RDB dump. As a result, memory usage reported is the serialized memory, which is not exactly the same as memory occupied on RAM.
- It does not have any built-in support for grouping, so it cannot find the largest namespaces.
4) Redis-Audit
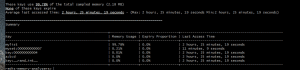
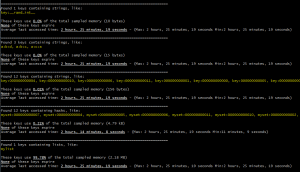
Redis-Audit is a probabilistic tool that’s useful for getting a quick overview of your memory usage. It outputs useful information on key groups, like overall memory consumption, maximum TTL in the group, average last access time, the percentage of keys in the group that expire, etc. This is the perfect tool if you need to find the most memory-hogging key group in your application.
Redis-Audit Installation and Usage:
You must have Ruby and Bundle already installed. Once installed, you can either clone the Redis-Audit repository to a folder or download the zip and unzip it to a folder. From that folder, run `bundle install` to complete the installation.
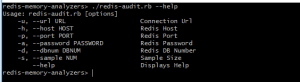
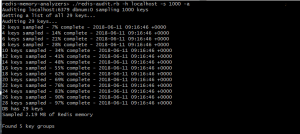
Usage is pretty straightforward: from the command line, execute ` redis-audit.rb hostname [port] [password] [dbnum] [sample_size]`
Redis-Audit Pros:
- Allows you to define your own regex for keyspace/prefix grouping.
- Works on all Redis versions.
- If the sample size is larger than the actual number of keys, it walks through all keys. On the flip side, this operation uses keys *, rather than scan – possibly blocking other operations.
Redis-Audit Cons:
- Uses DEBUG OBJECT command (unavailable in ElastiCache); as a result, it reports on serialized size – which differs from actual size occupied on RAM.
- The output is not very easy to parse quickly, as it’s not tabularized.
5) Redis Toolkit
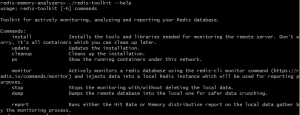
Redis Toolkit is a bare-bones monitoring solution that can be used to analyze two key metrics: hit rate and memory consumption. The project is periodically updated for bug fixes but does not have the community support some of the more famous tools enjoy.
Redis Toolkit Installation and Usage:
You must have Docker installed on your system. Then, clone the GitHub repository (or download as zip and unzip to a folder). From that folder, installation is as simple as executing `./redis-toolkit install`.
Usage is purely via command line, through a series of simple commands.
- To start monitoring hit-rate: ./redis-toolkit monitor
- To report hit-rate: ./redis-toolkit report -name NAME -type hitrate
- To stop monitoring hit-rate: ./redis-toolkit stop
- To create the dump file on local system: ./redis-toolkit dump
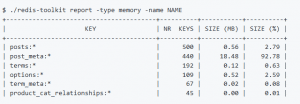
- To report memory usage: ./redis-toolkit report -type memory -name NAME
Redis Toolkit Pros:
- Easy-to-understand interface that gives you the exact information you require.
- Can group prefixes to whatever level is useful for you (so if you choose a:b:1 and a:c:1, they are counted as a:* or separately).
- Works on all Redis versions; does not require access to privileged commands like DEBUG OBJECT.
- Well-documented.
Redis Toolkit Cons:
- The memory analysis is not live; since it works on the serialized dump, the memory usage reported will not be equal to actual RAM consumption.
- A dump has to be created on the computer where Redis Toolkit is running. If you have a remote Redis instance, this can take a while.
- Monitoring the hit rate uses the MONITOR command to capture all commands that have run on the server. This can degrade performance and is a possible security risk in production.
- The hit rate is calculated as |GET| / (|GET| + |SET|). So if a value changes often, its hit rate will be lower, even if there never was an actual cache miss.
6) Harvest
This is a probabilistic sampling tool, that can be used to identify the 10 largest namespaces/prefixes, in terms of the number of keys. It’s one of the newest tools and has not seen much traction on GitHub. But, if you’re a Redis novice looking to identify what kind of application data is clogging up your instance, you can’t get anything simpler than Harvest.
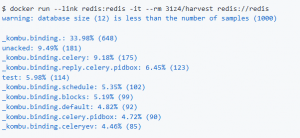
Harvest Installation and Usage:
This is downloadable as a Docker image. Once the image is ready, you can run the tool using the command ‘docker run –link redis:redis -it –rm 31z4/harvest redis://redis-URL’ from the CLI.
Harvest Pros:
- Works on live data.
- Uses the ‘memory usage’ command to get size information; hence:
- Gives accurate size information (rather than serialized size).
- Does not require access to the DEBUG OBJECT command.
- Your namespaces need not be : (colon) delineated. Harvest identifies common prefixes, rather than depending on regex-based namespace recognition.
Harvest Cons:
- It’s a one-trick pony – difficult to adapt it for any other use-case.
- The tool works only with Redis v4.0 and above.
- Minimal documentation.
Free Tool Limitations
While we found these tools very useful for debugging our Redis instances’ memory issues, you should be aware of the limitations of these free tools.
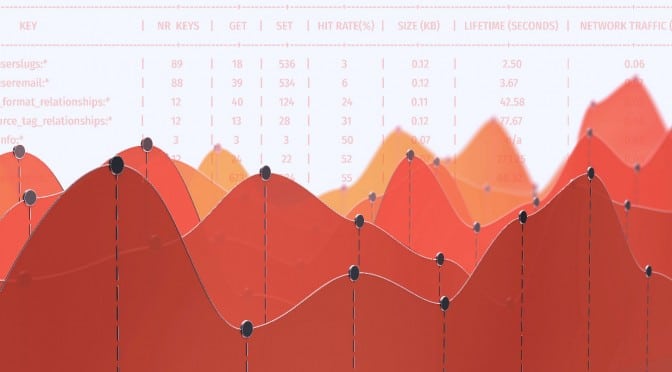
The paid tools almost always have some sort of data visualization, which is not available out-of-the-box with any of the tools we audited. The best you’ll get is a CSV output that you can use other FOSS tools to visualize, and many tools don’t even have that option. That makes for a steep learning curve, especially for novice Redis users. If you’re likely to do memory analysis often, it might be worthwhile to look at paid tools that provide good visualization.
Another limitation is the ability to store historical information. In keeping with the general *nix philosophy of making small tools that do just one thing, but do it well, the tools rarely venture into the monitoring space. Not even a memory consumption graph over time, and many can’t even analyze live data.
The Bottom line
One single tool will probably not suffice for all of your needs, but they’re pretty great weapons to have in your arsenal, paired with the monitoring capabilities provided by DBaaS solutions like ScaleGrid’s hosting for Redis™*! To learn more about the great tools available with our fully managed hosting services for Redis™, check out our ScaleGrid features for Redis™ by Plan page.