
So before you invest a lot of time and energy into a particular cloud it is important to understand the overall performance characteristics of MongoDB® on that cloud. We looked for this information and did not find it – so we decided to put it together for you as part of our performance series.
The Benchmark Rig
We decided to compare AWS, Azure, and DigitalOcean for this test. Two different sets of configurations were chosen. The table below summarizes the machine configurations:
| Provider | Region | ScaleGrid Medium* (Cores/RAM/Disk/Prov IOPS) |
ScaleGrid Large* (Cores/RAM/Disk/Prov IOPS) |
| AWS | US East | 1/3.75GB/60GB/300 | 2/7.5GB/120GB/500 |
| Azure | East US | 2/3.5GB/60GB/upto 2000 | 4/7GB/120GB/upto 4000 |
| DigitalOcean | New York 3 | 2/4GB/25GB/SSD** | 4/8GB/35GB/SSD** |
* Refer here under “Hosting for MongoDB®” for the details of machine configurations.
** DigitalOcean has directly attached SSDs.
The benchmark performance tests were run using YCSB Workload A (update heavy workload). We talked about YCSB, setting it up, and its workloads in a very detailed post last month.
- All benchmark tests were performed in a standalone configuration
- For both configurations, 5 million records were inserted with various levels of server load (based on the number of client threads).
- For the Medium configuration, then Workload A was executed with default values (50% Update, 50% Read) with an operation count of 5 million at various levels of server load.
- For the Large configuration, then Workload A was executed with default values (50% Update, 50% Read) with an operation count of 10 million at various levels of server load.
Results
We will discuss results based on insert performance and throughput/latency characteristics under update heavy workload.
Insert Performance
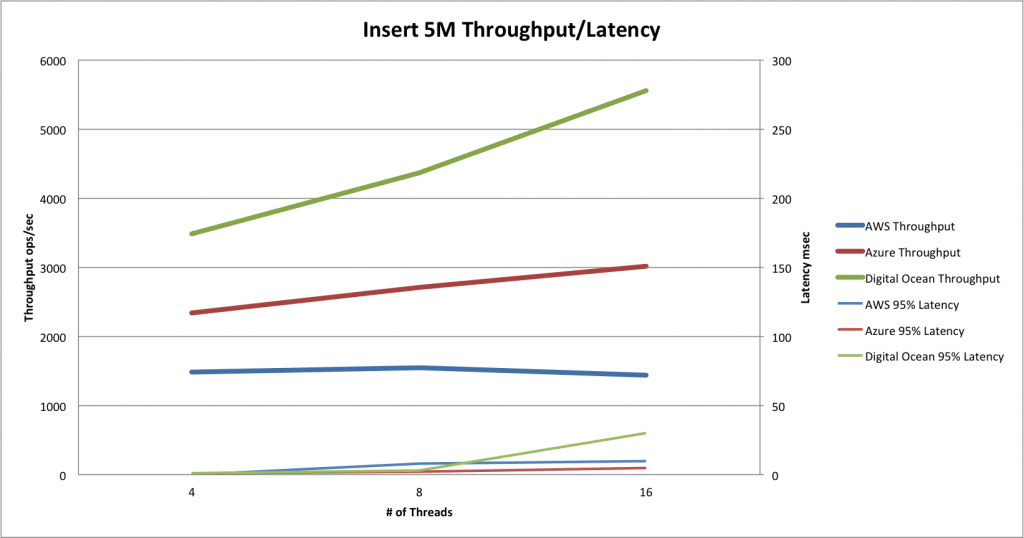
Medium Instances
The Throughput/latency characteristics for 5M record insertion on the Medium configuration:
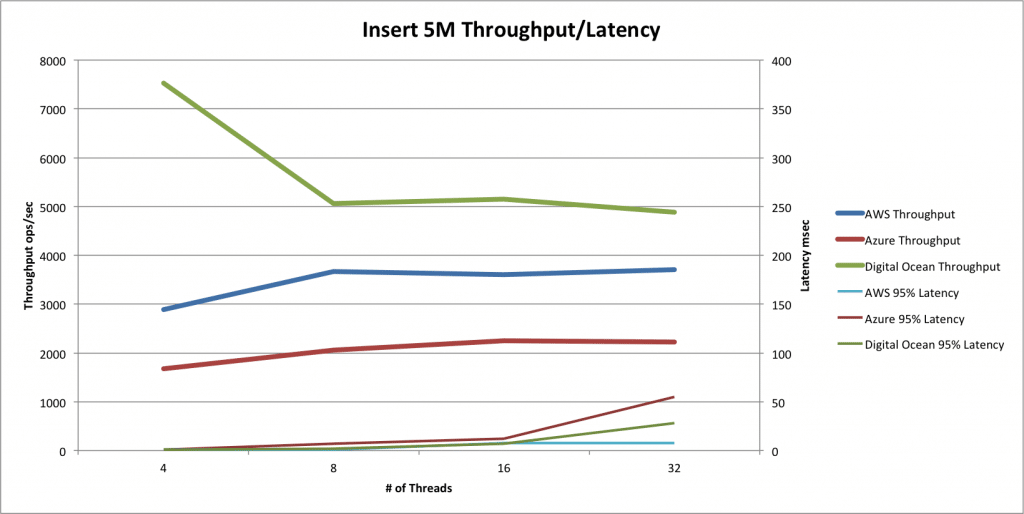
Large Instances
The Throughput/latency characteristics for 5M record insertion on the Large configuration:
Update Performance
Medium Instances
The Throughput/latency characteristics for 5M write/update operations on the medium configuration:
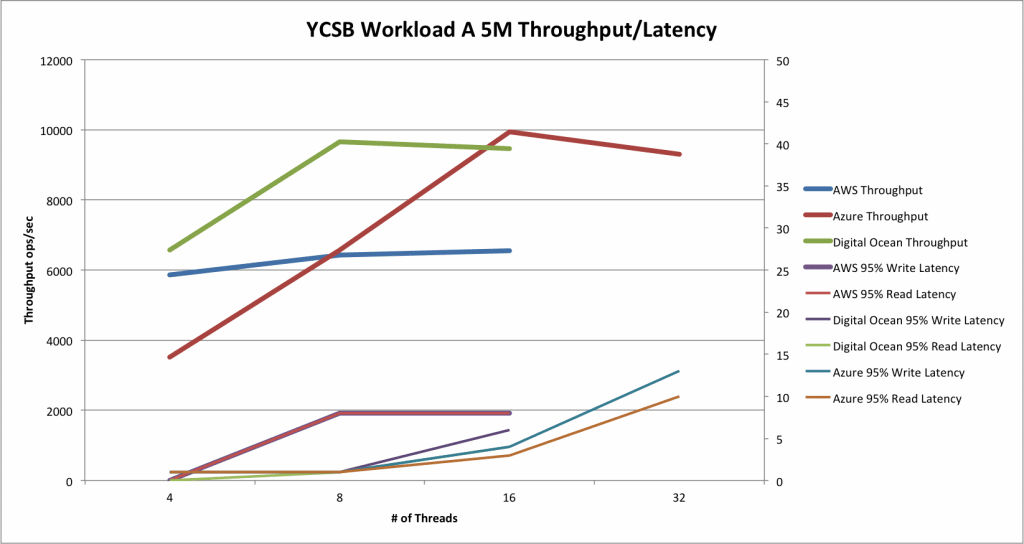
The test was run with 32 threads for DigitalOcean only. AWS and Azure were flat-lined at 16 threads. However, DigitalOcean gives the impression of scaling linearly until 32 threads.
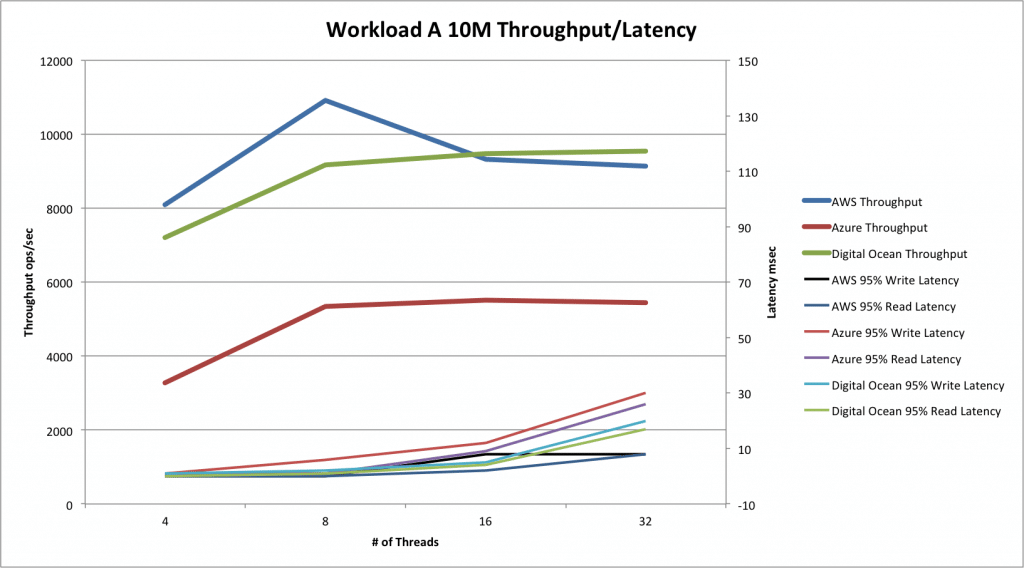
Large Instances
The Throughput/latency characteristics for 10M write/update operations on the Large configuration:
Overall Analysis
- As expected, MongoDB® on DigitalOcean has consistently high throughput/low latency characteristics throughout and beats the others hands down during the insert phase, extracting the maximum juice out of its local SSD drives. Interestingly, even though it goes very well during the read/update phase, other providers give it a fair bit of competition, especially when the server load increases. AWS/Azure is using much higher throughput networked storage.
- To get better performance from AWS disk, the user can use larger disk sizes or allocate more provisioned IOPS.
- On Medium instances, MongoDB® on Azure seems to do much better than AWS consistently, both during the insert and then update/read phases. This was surprising. The hardware is pretty evenly matched. In large instances, AWS performance is markedly better than Azure.
- Both AWS and Azure degrade in latencies pretty well as the load increases. Azure does seem to have a rather good latency degradation curve.
- Another interesting aspect of MongoDB® on AWS performance throughout is how “flat-lined” it is: Seems to degrade gracefully even on a log scale.
- Based on latency numbers, looks like the sweet spot, from a load standpoint, for Medium and Large instances is 8 and 16 threads respectively.