Understanding MongoDB® memory usage is crucial for a good MongoDB® hosting experience. For best performance, it’s imperative to keep your working set in-memory. I’ve seen a few suggestions that if you use solid-state drives (SSD), it makes memory less important. Dynamic random-access memory (DRAM) access time is of the order of nanoseconds, SSD access time is of the order of microseconds, and hard disk access time is of the order of milliseconds – so SSD’s still have a ways to go to catch up with memory.
MongoDB uses memory mapped files (MMF) to map the database into memory. Data is periodically flushed to the disk (obviously the mechanism is a lot more complicated, but that’s a topic for another post).
Once your MongoDB server is up and running, it’s important to monitor and understand the memory usage. In order to monitor our MongoDB servers, you can use the ScaleGrid MongoDB Monitoring Console to see detailed metrics on your performance. Run some sample workloads and establish a baseline so you can understand when something is not performing normally. Here are four important counters that will help you monitor your MongoDB memory usage:
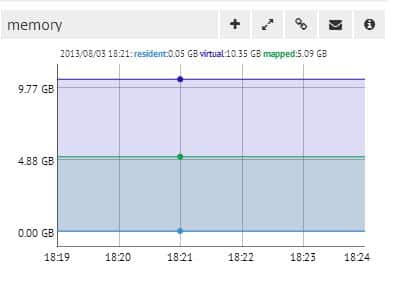
Memory
This is actually three counters in one graph:
Resident Memory
This is the actual amount of the physical memory being used by the MongoDB process.
Mapped Memory
This is the amount of virtual memory used by the MongoDB progress to map your database into memory. This will typically be the size of your database.
Virtual Memory
This includes the virtual memory for the entire MongoDB process. If you have journaling turned on, this will typically be twice the size of your mapped memory.
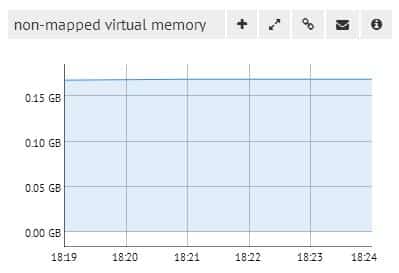
Non-Mapped Virtual Memory
This is the amount of virtual memory used for bookkeeping data and not for mapping the data files. For example, each connection consumes a certain amount of memory. Usually this counter should be fairly low – typically less than 1GB.
Page Faults
This is the number of hard page faults/second. Obviously you want this number to be as low as possible.
Hard Page Fault
This is triggered when the page in question is not in physical memory and needs to be fetched from the disk.
Soft Page Fault
This occurs when the page is resident somewhere else in-memory or is in a transitional state.
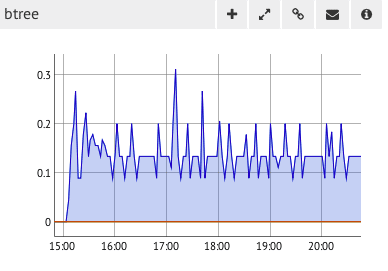
B-tree (Index Miss)
An index miss is twice as inefficient, as it causes two disk reads, one to read the index entry and another to read the document. The B-tree counter tracks the number of index misses. This is another place you’ll want to establish a baseline to spot any unusual patterns. Use the .explain() command to check the query plans for your common queries.
Another important aspect of memory management in MongoDB is to understand your ‘Working set’. In our next post, we’ll examine how to determine the working set for your database.


